
A charting application is a software program that allows you to create a graphical representation of data based on some tabular, numeric, and non-graphical data entered by a user, most often through a spreadsheet application.
Here are 15 useful Java Charting and Reporting Tools to create professional charts for your applications.
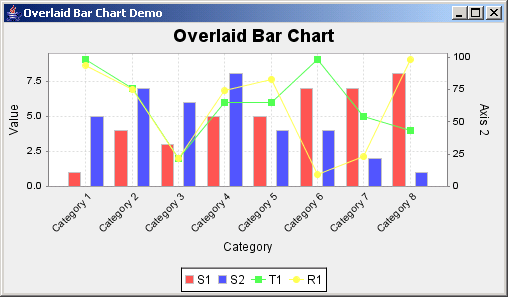
JFreeChart
jFreeChart is a 100% open-source java Chart library that allows the developer to create professional charts like bar charts (horizontal and vertical, regular and stacked), line charts, pie charts (2D and 3D), time series charts, candlestick charts, scatter plots, histograms, bubble plots and simple Gantt charts for their applications.
Download: JFreeChart – Java charting library
Java Chart Contraction Kit ( JCCKit )
JCCKit is a Java Chart Contraction Kit to create scientific charts and plots. The Charting library is specially designed to provide a flexible kit for writing applications with the need for visualizing scientific data.
It is written in JDK 1.1.8 platform (except for a Graphics2D renderer), and it’s a perfect solution for scientific Applets and PDAs running a Personal Java implementation.
Download: JCCKit
JasperReports – Java reporting library
JasperReports is one of the most popular and useful Open Source Java Charting and Reporting Library that allows you to access data coming from any data source and produces a pixel-perfect report that can be viewed, printed, or exported in a variety of document formats, including HTML, PDF, Excel, OpenOffice, and Word.
Download: JasperReports
Java-based Eclipse BIRT Chart Engine
Business Intelligence and Reporting Tools (BIRT) is an Open Source Eclipse-based charting and reporting system that provides reporting and business intelligence capabilities for rich client and web applications based on Java and Java EE to produce compelling reports.
Download: Business Intelligence and Reporting Tools (BIRT)
JGraphT – free Java graph library
JGraphT is a free java charting and reporting tool that provides mathematical graph-theory objects and algorithms.
It supports various types of graphs like a graph with weighted/unweighted / labeled, simple graphs, multigraphs, Unmodifiable graphs, listenable graphs, Subgraphs, and many more.
Download: JGraphT free Java graph library
jCharts – Java-based charting library
jCharts is a java charting and reporting tool that outputs a variety of charts.
Download: jCharts Java-based charting library
Cewolf charting application
Cewolf is a Servlet/JSP-based web application to embed complex graphical charts of all kinds, such as line charts, pie charts, bar charts, plots, etc., into a web page.
Cewolf charting application is based on JFreeChart, and it uses the rendering engine of JFreeChart to render the final chart image into the client’s response stream. Everything is done on the client side; No files are created on the server side.
Download: Cewolf Chart
iReport – Java Visual Report Designer for JasperReports
iReport is an Open Source java visual report designer for JasperReports and JasperServer. With iReport, users can create sophisticated, beautiful layouts which include charts, images, subreports, crosstabs, and much more.
User can also access their data through any sources like JavaBeans, JDBC, TableModels, XML, Hibernate, CSV, and via other custom sources and then publish them on your reports as PDF, RTF, XML, XLS, CSV, HTML, XHTML, text, DOCX, or OpenOffice format.
Download: iReport
JChart2d – java charting library
JChart2d is a minimalistic real-time java charting and reporting library for displaying two-dimensional traces in a coordinate system written in Java. It supports animated charting, custom trace rendering, Multithreading, viewports, automatic scaling, and labeling.
Download: JChart2D Java charting library
JOpenChart – chart library and toolkit for Java
jOpenChart is a free chart library and toolkit for Java that provide various types of charts, including pie charts, line charts, and plot charts, for embedding them into various applications, no matter if they are server-side, desktop, or web applications.
Download: jOpenChart chart library
DataVision – java reporting tool
DataVision is an open-source reporting tool similar to Crystal Reports. With the DataVision reporting tool, users can create a perfect report by using a drag-and-drop GUI; also easy to run, view, and print directly from the application or export them into HTML, XML, PDF, Excel, LaTeX2e, DocBook, or tab or comma-delimited text files.
Download: DataVision
OpenReports – Open source Java Reporting Tool
OpenReports is a Powerful, easy-to-use, Flexible, open-source web reporting solution that provides browser-based, parameter-driven, dynamic report generation and flexible report scheduling capabilities.
Currently, OpenReports provide support for various open-source reporting engines such as JasperReports, JFreeReport, JXLS, and Eclipse BIRT.
Download: OpenReports
Pentaho Reporting
Pentaho Reporting is a java library that allows you to create an interactive report and customize them against a wide range of data sources.
It has an easy-to-use, simple, web-based reporting user interface for the casual business user and a rich design interface for report developers and business analysts who need to create precise and pixel-perfect enterprise reports.
Download: Pentaho Reporting
JMagallanes
JMagallanes is an open-source end-user application for OLAP and Dynamic Reports written in Java/J2EE. It combines static reports (based on JasperReports), a Swing pivot table for OLAP analysis, and charts (based on JFreeChart).
Download: Jmagallanes
FreeReportBuilder – free java report tool
FreeReportBuilder is a free java report tool that allows you to create a simple report quickly. it works with any database that has a JDBC driver, also user can create SQL queries without directly writing SQL. All Reports produced by FreeReportBuilder are saved in XML format.
Download: FreeReportBuilder


This Post Has One Comment
NextReports has a free reports&charts designer and a commercial server.